Summary
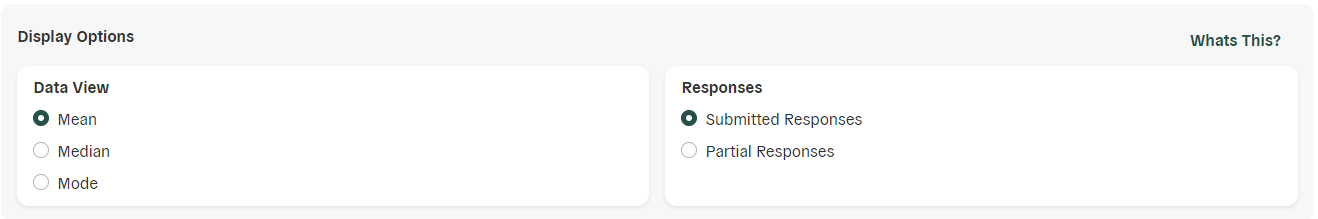
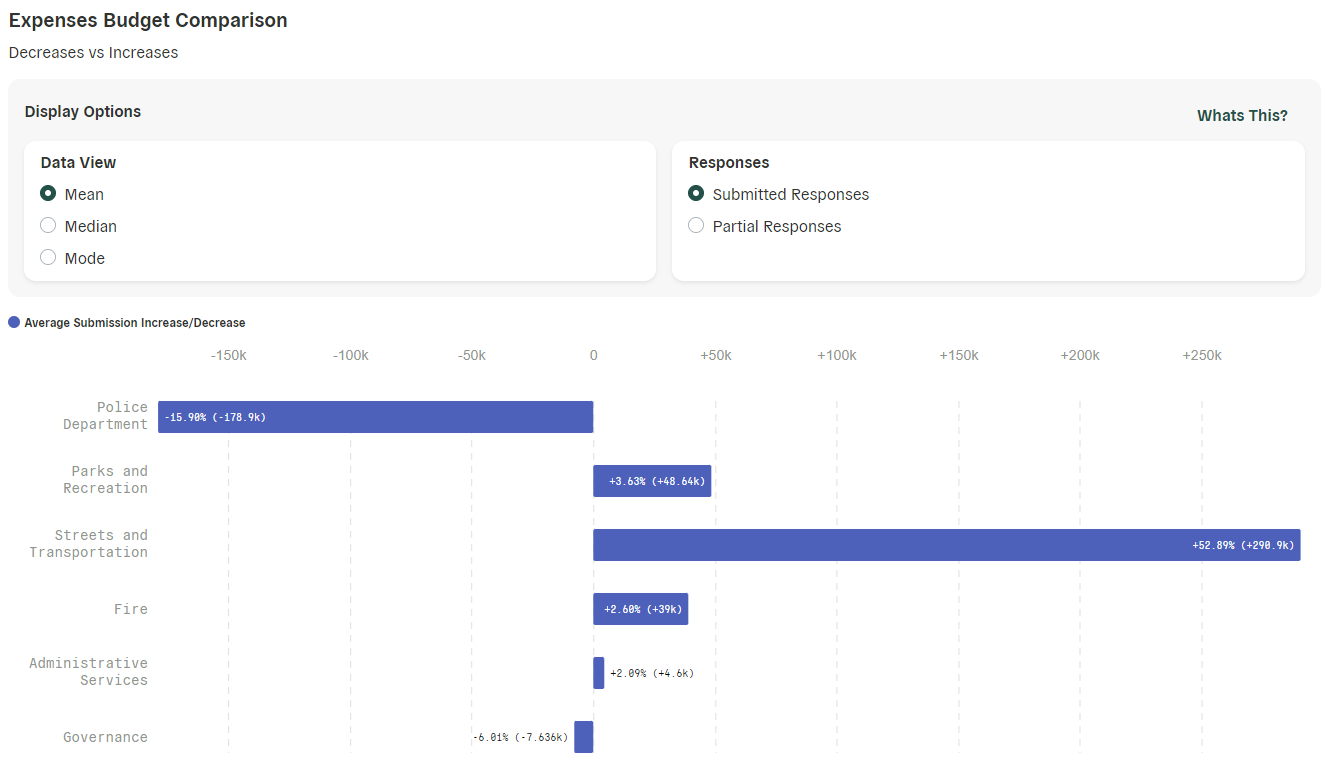
When viewing your budget or housing simulation results on Polco, you’ll see multiple display options for data visualization (mean, median, and mode) and response categories (submitted responses versus partial responses). These options allow you to analyze and interpret your results from different perspectives.
In short: Mean provides the average value, median focuses on the middle value, and mode highlights the most common value. Below are some additional details about each, including benefits, drawbacks, and possible use cases.
Display options
Mean
The mean is the average value of a dataset. It's calculated by adding up all the values and then dividing that sum by the total number of responses. The mean offers insight into the central tendency of your data.
The mean is most suitable for balanced datasets without significant outliers. This measure excels when the data follows a symmetrical distribution, such as a normal or bell curve. In balanced datasets, the mean provides an unbiased representation of the typical value, as it equally considers each response. However, when the data is skewed or contains extreme values, the mean can be influenced and may not accurately represent the central value. In such cases, using the median might be more appropriate.
Median
The median is the middle value in a dataset. It is determined by sorting the dataset in ascending or descending order, then finding the value that divides the dataset into two equal halves. Opting for the median view of simulation results focuses on the midpoint, offering insight into the typical response or outcome.
Compared to the mean, the median is less affected by outliers, making it a better option for datasets containing extreme values. It’s especially useful when a few extremely high or low values could heavily impact the mean, as the median provides a more representative typical value. Additionally, the median is suitable for ordinal or skewed data, where the order or rank of values is more significant than their actual numerical values. In these cases, the median serves as a reliable measure of central tendency, highlighting the middle point without being overly influenced by outliers.
Mode
The mode represents the value that appears most frequently in a dataset. While the mean and median both show central tendencies of data, the mode highlights the most prevalent value or outcome. Selecting the mode option allows you to pinpoint the most popular choices, giving you insights into the dominant opinions and preferences among participants.
Because the mode is not affected by outliers, it’s a good choice for datasets with extreme values. However, it may not fully capture the complexity of certain distributions. If your data has minimal variability (most values are close to a single value) or multiple modes (when two or more values appear with equal frequency), relying solely on the mode may not provide fully representative results.
Response categories
Submitted responses
This setting shows only simulations that were fully completed and submitted by participants. Viewing submitted responses allows you to focus on the outcomes where the participants have considered all the data, adhered to the simulations’ requirements, and finished the simulation. This option will provide the most comprehensive overview of participants’ responses.
Partial responses
This view allows you to see results from participants who did not fully complete and submit the simulation. Although these results will not reflect the most complete and accurate simulation results, viewing partial responses (i.e., which items participants adjusted, and by how much, before they left the simulation) can provide valuable insight into the issues that participants felt most strongly about.
Conclusion
Effective analysis of simulation results often requires viewing the data from multiple angles. Deciding which of these display options to use depends on your specific goals and the nature of your data. Because each display option contributes a unique perspective, we recommend combining these views to gain a more holistic understanding of your community’s preferences and facilitate more informed decision-making.