When you create your own survey on Polco, your results will look a bit different than they would in one of our benchmark surveys (like The NCS). One difference is that you’ll see three tabs below your closed survey: Participation, Results, and Advanced Results.

Filters: Respondents to your surveys represent people both inside and outside your community, as well as both registered and unregistered voters. In order to see who is responding to your survey, or if you’d like to see only verified respondents or respondents within city limits, you can filter your result views under the “Results” tab. Learn how here.
Filters are useful in the following scenarios:
-
“I only want to see responses from people who live in my city.”
-
“I only want to see responses from verified respondents.”
-
“I only want to see responses from my subscribers.”
Crosstabs (Breakdowns):
Under Advanced Results, you’ll see gender, age, and precinct breakdowns for each question. This will help you understand your results more specifically. Sometimes it is helpful to understand how verified residents or specific demographics (age, gender, etc.) felt relative to other groups. You can view verified results and breakdowns to achieve this level of understanding. For example, perhaps we expect a decision to disproportionately affect young women and want to make sure we have a strong understanding of their preferences. That's where crosstabs/breakdowns can help.
Crosstabs, or breakdowns, are useful in the following scenarios:
-
“I want to look at results based on voter precinct.”
-
“I want to see how results differ based on where respondents live (i.e. how do the needs of residents in my voter precinct differ from other parts of the city?).”
-
“I want to see answers to a specific question by age or gender.”
In order to get the best crosstab functionality, you’ll want to use Polco’s pre-created demographic questions on your surveys. This also ensures that registered respondents only have to answer these questions once (and not on every survey).
You can find breakdowns of responses by demographic group under “Advanced Results.”
To get there, follow these steps:
-
Navigate to your survey that you wish to see results from (in Content section)
-
Select “View” and scroll to the bottom of page
-
You’ll see an options bar with different selections (For example: see below screenshot)

-
From the options, select “Advanced Results.”
Here you’ll be able to see your survey results by multiple demographic breakdowns (age, gender, rent/own, completed education level, and any other pre-created demographic questions you used on your survey).
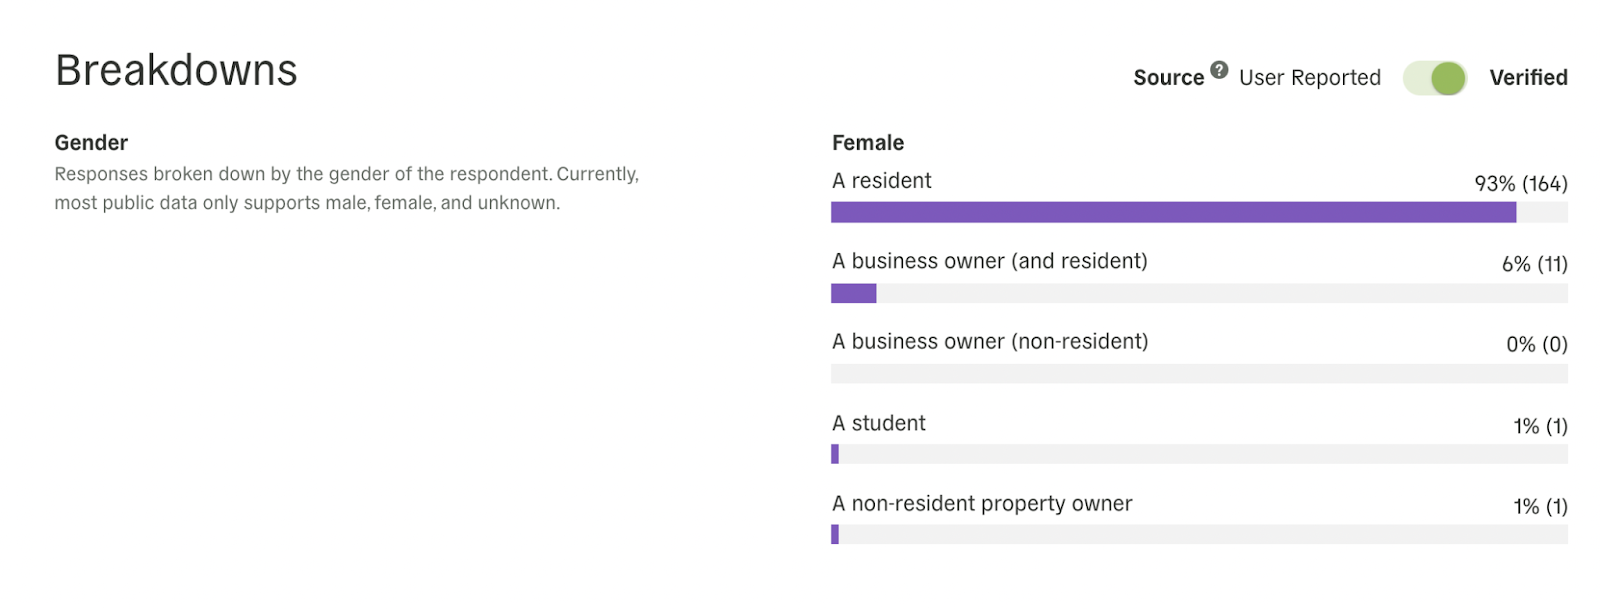
The toggle that lets you choose between “User Reported” and “Verified” responses means that you can see results from both verified respondents and those who are not yet verified. Toggle this on or off to see responses from all respondents (User Reported) or from only verified respondents (Verified). This toggle affects all the breakdowns below it.