
Watch this video tutorial about how to find and navigate your CASOA report, or read on for a written overview! You can also jump to a specific section of this article by clicking the item below:
Locating Your Report on Polco
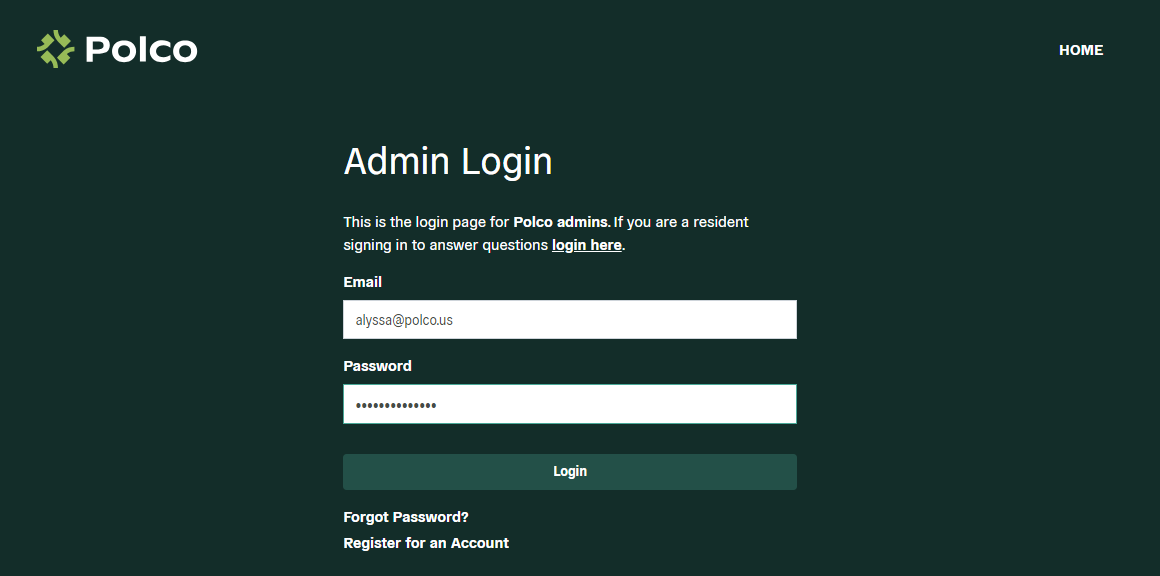
To begin, you’ll need to log in to your Polco profile. If you have not yet set up an account, please reach out to your designated Customer Success Manager or CASOA Project Manager (or success@polco.us) to help get you started.
Once you are logged in to Polco, you will see the Participants page, pictured below. To access your CASOA report, click on the “Benchmark Reports” section under “Assess”. From there, you can select the “View Report” button in the CASOA section.
The online interactive version of the report is organized by tab. To navigate, you can scroll up and down to view the full text in each section. When you are ready to move on or would like to look at a specific section, select the desired tab at the top.
Exploring Your CASOA Report
Below you’ll find a brief overview of each tab in your CASOA report. Don’t be afraid to click around and explore--there’s a lot of data to dig into!
If you have limited time or are feeling unsure about where to begin, we recommend starting with the Introduction, Key Findings, and Community Livability Topics tabs. These will provide a great, high-level overview to the survey effort and overall results. If you want to dive deeper into the details, the Community Livability Topics, Crosstabs, and Responses sections provide a lot of more granular data.
Introduction
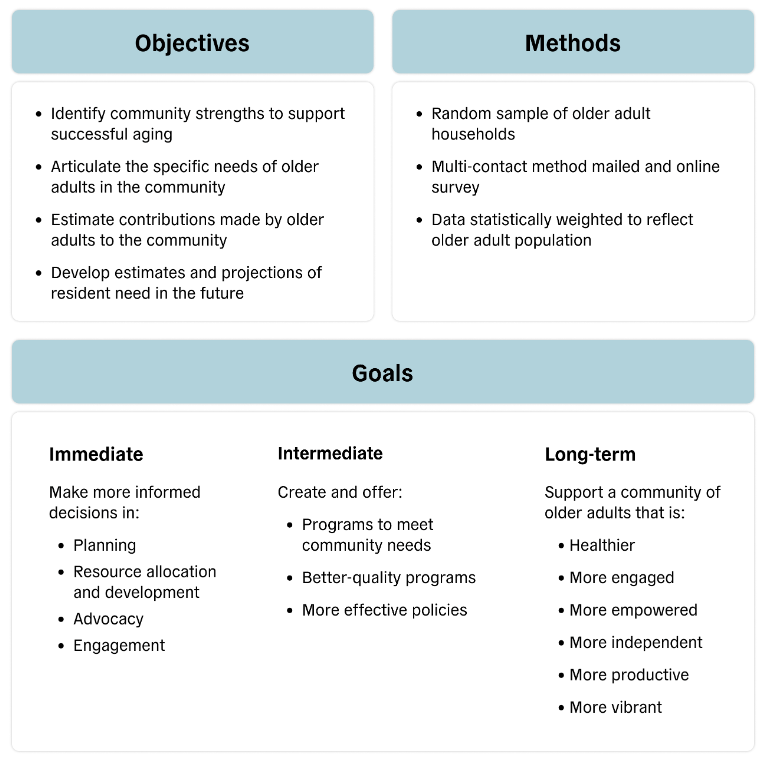
The report starts with an introduction, which explains how the survey was organized, the different domains of community livability assessed in the survey, and the specific topics covered in each of those domains. There’s also a brief summary of the methodology Polco uses, but if you’d like more detail on that, check out the Methods tab later in the report.
Key Findings
This section summarizes results from the survey across each of those different domains. These results are presented in a written format that's easily shareable and highlights some of the most important data points in each area.
Community Readiness
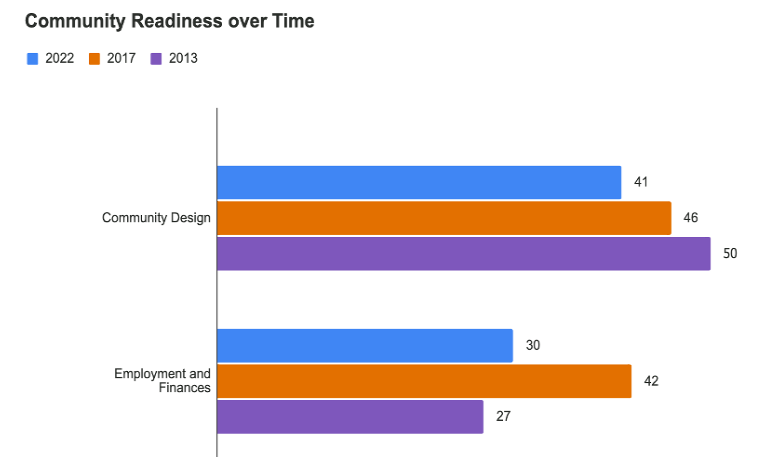
On this tab, you’ll see some charts and graphs that help visualize your area’s overall performance across these domains. If your area has conducted this survey in the past, you’ll also see how your overall domain scores have changed over time. In this section (and in other tabs throughout the report), there are footnotes at the bottom that can provide some more context and help you interpret the results.
Community Livability Topics
The Community Livability Topics tab is one of the most interactive report sections, designed to help you dive deeper into the results, which makes it more ideal to view online than in PDF form. Here, you’ll see donut charts for each of the 17 individual topic areas within the six domains of livability. These provide a high-level visual overview of the results.
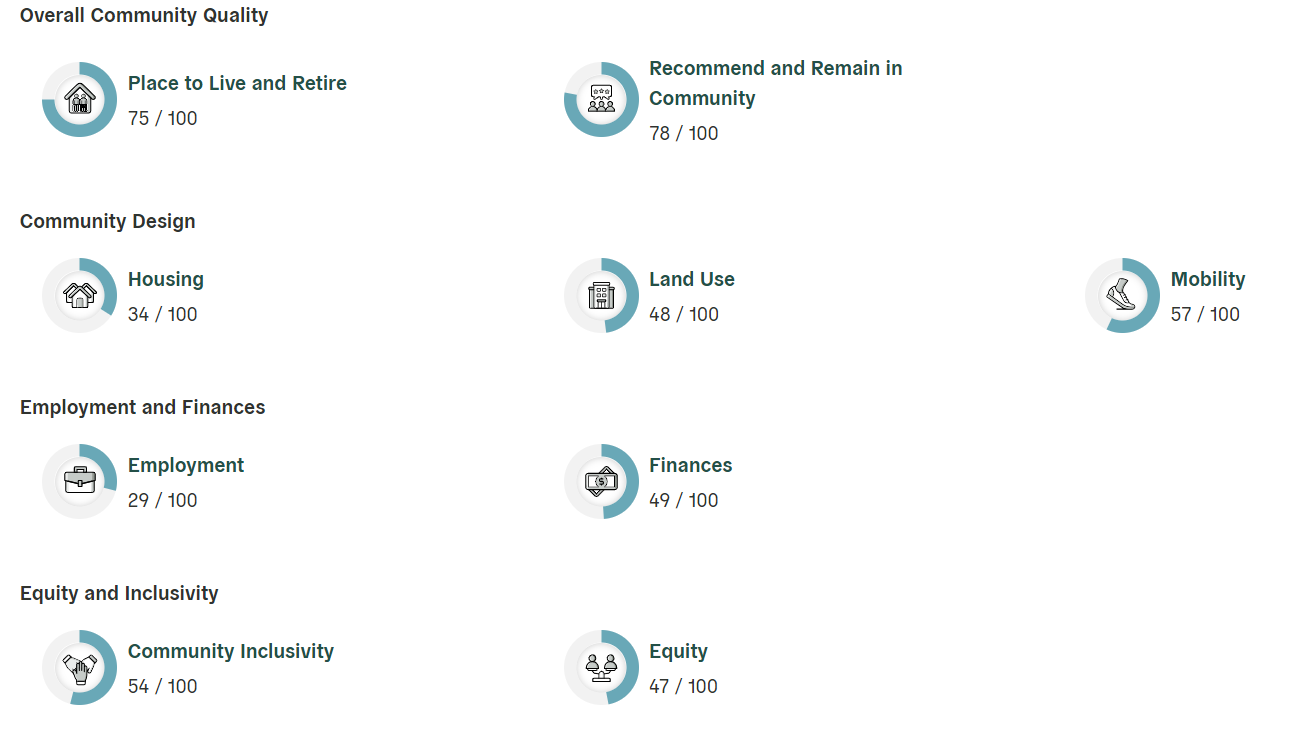
Clicking on any of these topic areas will show even more granular data, including trends over time (if available), percent positive or problematic (depending on how the question was framed), and comparisons to benchmark communities. You can choose to view the results as either a table or graph. Each view includes a legend that helps interpret the benchmark comparison icons.
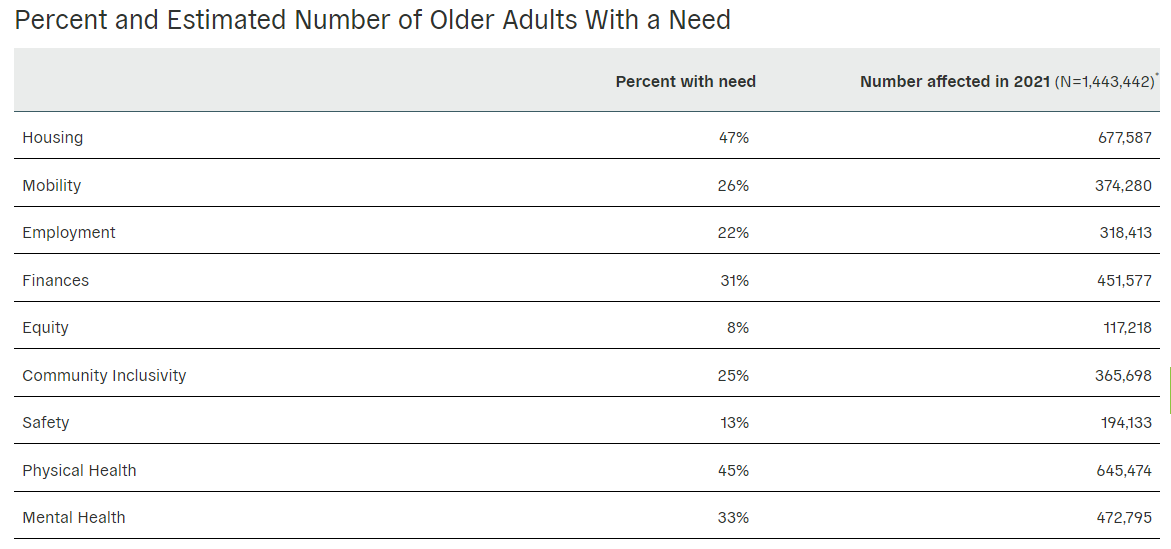
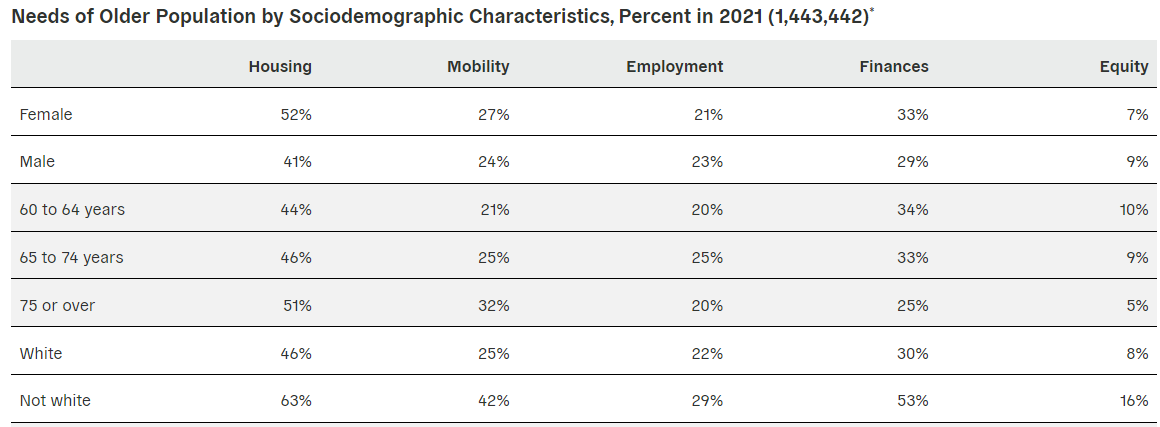
Community Needs
The Community Needs tab extracts data from the survey results to estimate the amount of older adults with needs in specific areas for your entire population based on how participants responded. This information can be further broken down by sociodemographic characteristics, which can be really helpful when addressing older adult needs in your community.
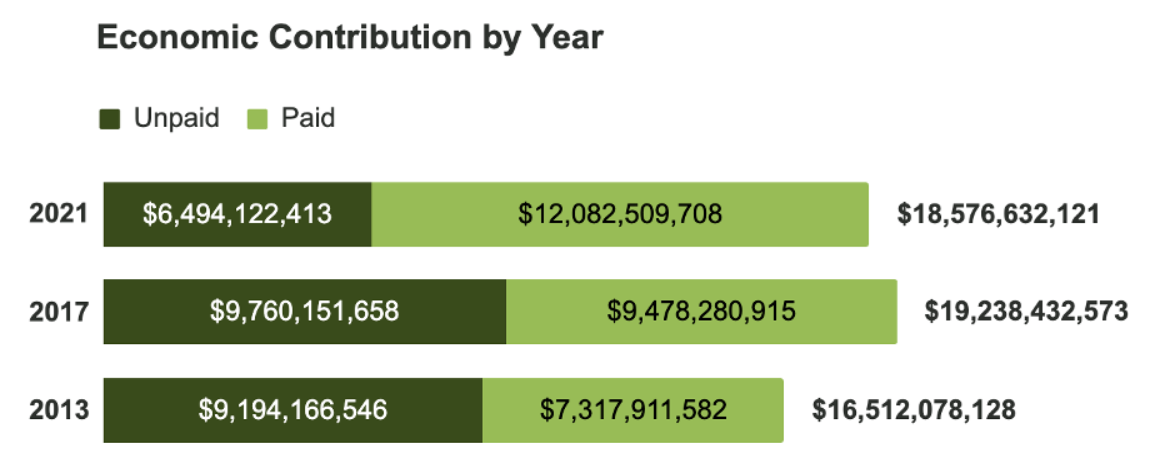
Economic Contribution
The Economic Contribution tab looks at the amount that older adults in your community contribute both with unpaid and paid work. This data is calculated using both the community survey data and Bureau of Labor Statistics information.
Crosstabs
You could spend a lot of time digesting results in the crosstabs! Here, you can get much more granular information about results from different demographic groups. First, pick any topic area and demographic trait from the drop-down menus.
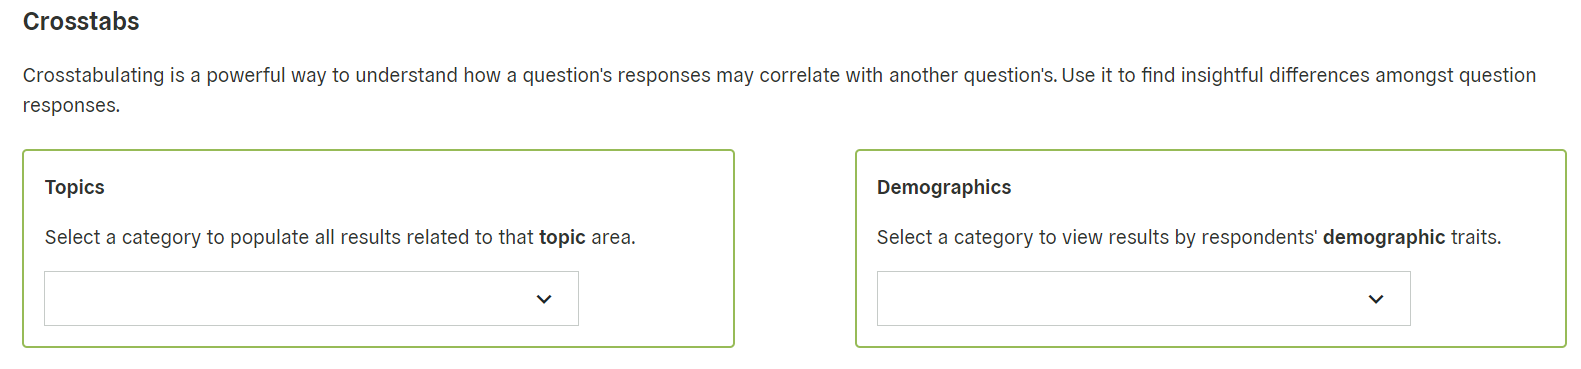
You’ll then see a table showcasing the responses grouped by that demographic characteristic. Cells with a purple border indicate a statistically significant difference from at least one other demographic group. Click on one of these cells to activate “focus mode” and quickly see demographic groups with statistically significant differences in responses for that survey item.
Responses
The Responses section is where you'll find a complete list of all of the survey questions and responses. You can choose a specific topic area in the left sidebar to view all related questions. The results for each question can also be expanded, if desired, to show more granular data (such as how many respondents chose each response option).
Methods
Last but not least, the methods section can help answer questions that residents, community stakeholders or other leaders in your community may ask, such as, “How was this survey conducted? How was it representative? How was the sample selected?” This section covers how we developed the survey itself, the random selection and data collection processes, and details about analysis and reporting. It also includes the weighting tables showing how the unweighted results compare to the target population, and more!
Conclusion
That’s an overview of how to navigate your CASOA report! In addition to your online report, you also have access to a PDF version; just click the “Download PDF” button in the upper right-hand corner of the online report. However, keep in mind that the interactive sections (primarily the Crosstabs and Community Livability Topics) in the online report will not be interactive in the PDF. Otherwise, the PDF is a great way to share the results more publicly.
If you have any questions about your report, please contact your Polco CASOA Project Manager or Customer Success Manager, or reach out to success@polco.us!