
The GPAL partnership powers the data available in Polco’s Track Module and Community Insight Dashboards. Check out our virtual tour of the Overview dashboard here!
When you’re ready to explore your own, click on “Track” in the left side navigation menu. In the dropdown that appears, select “Overview.”
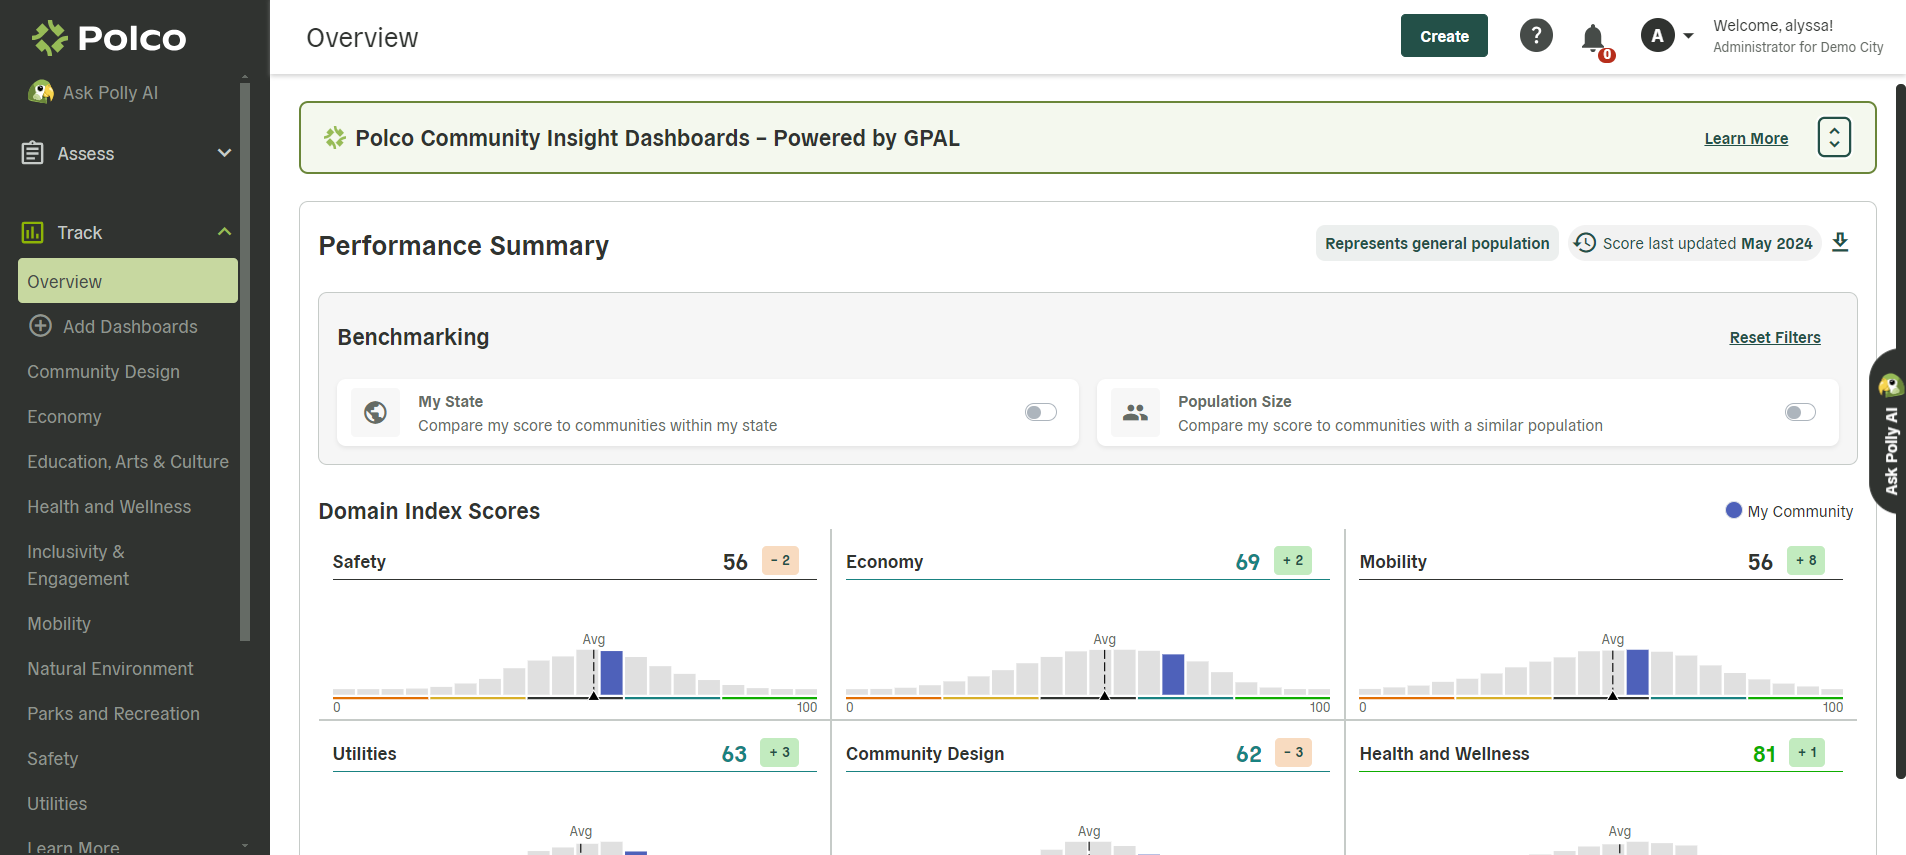
On the Overview dashboard, you’ll first see:
-
Data categorized into 10 domains of community livability: Safety, Economy, Mobility, Utilities, Community Design, Health and Wellness, Education, Arts, & Culture, Inclusivity & Engagement, Natural Environment, and Parks and Recreation
-
A calculated index score for each domain, for easy evaluation of overall performance in a given area (based on both public data and resident sentiment data, when available)
-
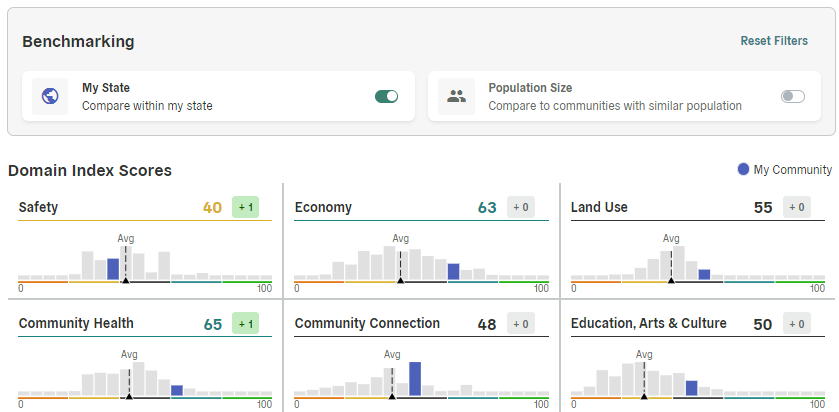
The ability to compare your community’s domain index scores to communities across the entire nation (default) or to filter comparisons by location and/or population size
-
Histograms to help visualize your community’s index scores and placement in these comparisons
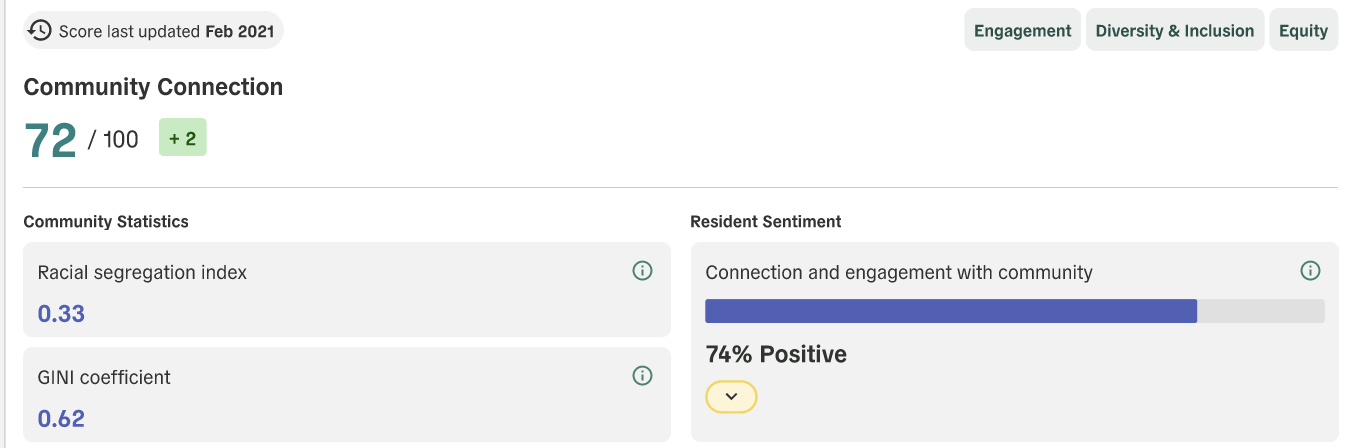
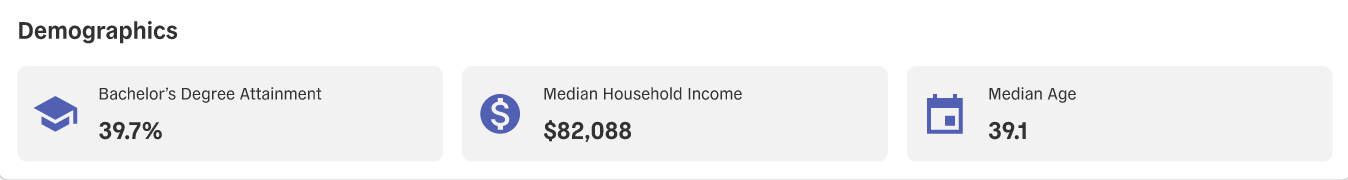
Scrolling a bit further, you’ll see specific data points, including:
-
Select performance indicators for each domain (both community statistics and resident sentiment data, when available)
-
Demographic indicators relevant to the community
To dive deeper into any of these specific data points or topic areas, check out our Domain Dashboards! These offer more extensive analysis opportunities, providing dozens of data points relevant to each domain, complete with historical trends over time and benchmark comparisons to other communities.
Additionally, you can save time and effort by using Polly, your very own AI Data Analyst, to digest all of this information! Polly can help recall specific data, synthesize trends, and lighten the load for grant writing, strategic planning, and more. Make data-driven decisions more easily with this robust dataset and AI assistant at your fingertips.