
Sometimes, despite your best outreach efforts, your raw survey results will not be fully representative of your entire community. We often tend to see higher rates of participation from individuals within certain demographic groups (e.g., older adults, homeowners, women) and lower response rates from others (e.g., younger adults, renters, men).
Polco’s representivity visualizations and automatic weighting functionality help address this issue. Automatic weighting adjusts survey results based on respondents’ demographics. This helps amplify the voices of underrepresented residents and provide more representative data overall.
How to use
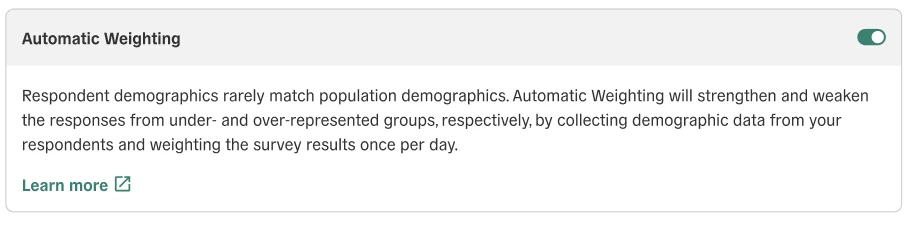
Automatic weighting functionality can be toggled on for each individual survey on the Summary tab. (If this toggle isn’t available on your profile, reach out to your Customer Success Manager (CSM) or success@polco.us for more information.)
When using the automatic weighting feature, you’ll need to add some of Polco’s pre-built demographic questions to your survey. These questions can be easily added with one click to any survey draft. Although some respondent demographic data may come from voter registration records, the vast majority is gathered through user-reported answers to these specific demographic questions.
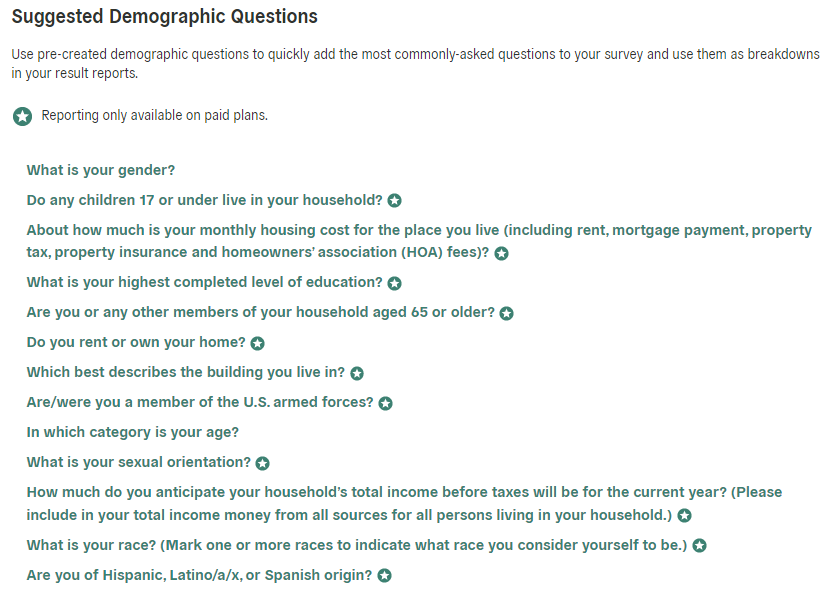
For automatic weighting to be most effective, we recommend you add the following suggested demographic questions to your survey:
- What is your gender?
- In which category is your age?
- What is your race?
- Are you of Hispanic, Latino/a/x, or Spanish origin?
- Do you rent or own your home?
- Which best describes the building you live in?
Omitting these demographic questions may limit or negate the automatic weighting feature’s effectiveness. While automatic weighting will still function with only a few of these questions in your survey, your resulting data will be more accurate if all questions are included.
Viewing and using weighted data
After the survey is published and has received at least 10 responses, the auto-weighting calculations will run once per day. The weighting algorithm compares the respondents’ demographics to Census data for the entire population, adjusting the data to reduce discrepancies between the two. In the Results tab, you can toggle between Weighted and Unweighted results to view each dataset as needed.

We caution against making decisions based on very few responses; even with weighted results, it’s unlikely that only 10 or 20 responses are truly representative of your whole community. For this reason, we suggest expanding and adjusting outreach efforts (informed by the representivity graphs) to increase participation overall and bring more people into the conversation, rather than relying solely on weighting to achieve complete representation. Together, these tools will strengthen your engagement efforts for current and future surveys, providing more accurate results and fostering more confident and informed decision-making.